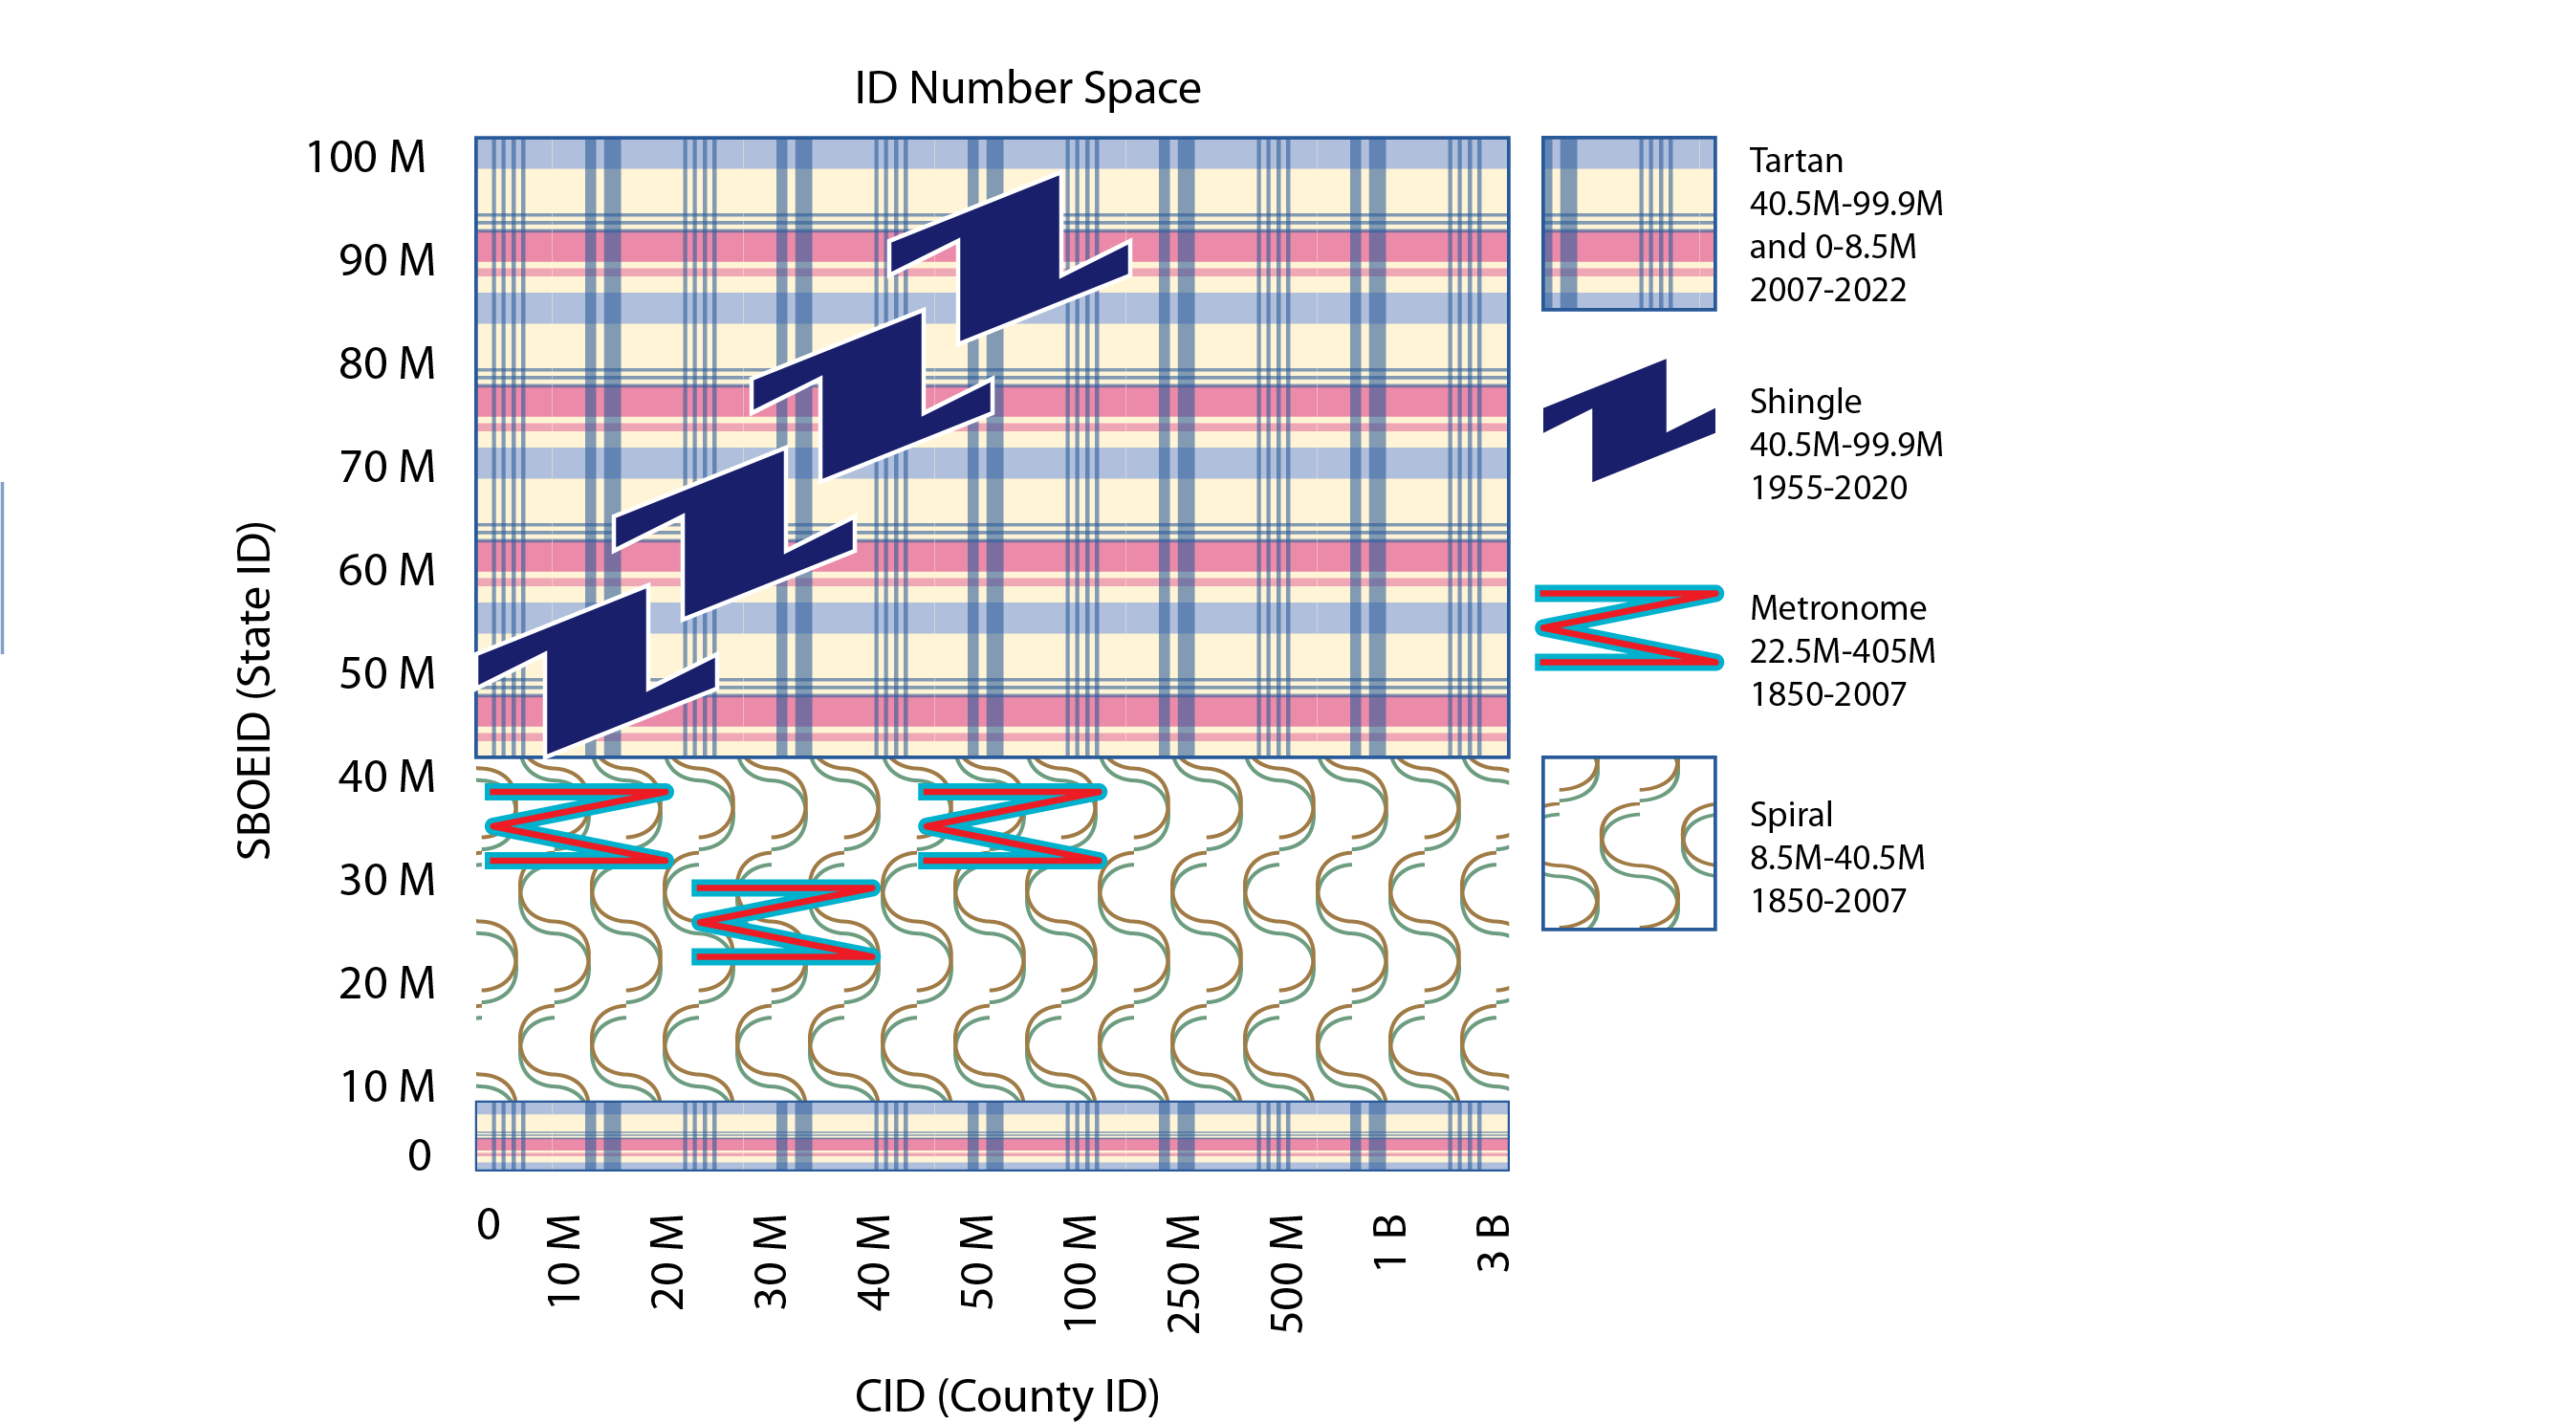
Number Space
The number space is the range of numbers used for ID numbers. For State Board of Elections ID (SBOEID) numbers, the range is 1-99,999,999. However, the lowest number used is 3,306,194 and the highest is 62,282,585. County ID (CID) numbers have a much wider range and there is some overlap between counties that use the same number ranges. The lowest CID is 1, and the highest is 3,000,100,862.
The illustration above makes it look like the Shingle overlaps the Tartan, which is partly true, and that the Metronome overlaps the Spiral, which is not true. The “In-Range” partition of the number space (Spiral and Metronome) is strictly segregated into 62 blocks of numbers, one for each county. The three Metronome counties, Erie, Nassau, and Westchester, use the numbers assigned to them in the partition, but a different algorithm than other counties. There are narrow spaces, like tunnels, surrounding Shingle numbers, keeping them distinct from Tartan numbers.
In-Range
The above illustration represents the mapping of in-range SBOEID numbers. The color coding is meant to designate different algorithms in use. However, since the time the illustration was made, I have proved that NYC, Schoharie and Wyoming counties use the Spiral, like most of the others, and should be coded the same. Originally, they looked different because of the way those counties assigned the CID portion of the ID number set.
Date Range
No illustration here, but it needs an explanation. For most numbers, the following are true:
All in-range numbers were assigned before June 2007, based on registration date
All out of range numbers were assigned in or after June, 2007
There are exceptions:
The registration date for in range numbers is occasionally later than June 2007. This happens because, although the number was originally assigned before that date, the person has moved to another county after that date. The registration date is then updated, but the SBOEID number remains the same one assigned earlier.
Shingle records are almost all suspicious. One reason for this is that they are all out of range but almost 100% (more than 99%) have registration dates before 2007 and those records are more than 99% purged. If they followed the same registration date pattern found in the Tartan, none of the registration dates would be earlier than June, 2007.
It is an open question whether these pre-2007 dates are genuine or falsified. The only legitimate explanation I have been able to come up with is that these purged records retained their original registration dates (pre-2007) when the new system went online in 2007, but if so, do not understand why they weren’t included in the Spiral algorithm instead.
Extremely early registration dates, such as 1/1/1850, can be found almost anywhere. These appear to be false dates.
Shingle, Nassau
This illustration shows most of Nassau’s 210,00 (or so) Shingle registrations. The green dots are cloned records, blue dots are purged. Orange dots are the extremely rare active registrations overlapping from the Tartan. In this case, the green dots overlap blue dots because 100% of the cloned records are also purged. What is interesting here is that there is a perfect falloff from 100% purged/100% cloned to 100% purged/15% cloned. The highest numbers are 100% clones, the lowest numbers are about 15%. In between, there is a perfect gradient falloff in density. This almost certainly indicates that the records were known clones, and thus invalid, at the time the ID numbers were made.
Another curiosity is that there is no clear relationship between registration date and ID numbers. This is the same as the Spiral, and is caused by the use of the algorithm. In the Shingle, this makes the gradient falloff of clone registrations more strange, because it implies that the upper range of ID numbers, which are not assigned based on date, were not only reserved for clones, but that the entire range was reserved for clones, but in different proportions depending on which shingle the numbers were assigneed to.
Put simply, the algorithm is likely aware that these are illegal registrations and has been designed to hide them. This is probably a reversible process that allows easy identification of bad records. That is a very handy tool for anyone who wants to commit fraud.
That is still quite an astonishing feat to have been able to discover and reverse-engineer algorithms, let alone keep all those rules and disparate data in your head! You have a great gift there. I struggle sometimes just to simply follow and comprehend. If you were to put percentages on how much you were able to have done all you did 1) using spatial relationships (plotted data) vs. 2) using advanced mathematics (formulas), what do you think the numbers would be? 1) 80% and 2) 20%? Or some other percentage ratio?